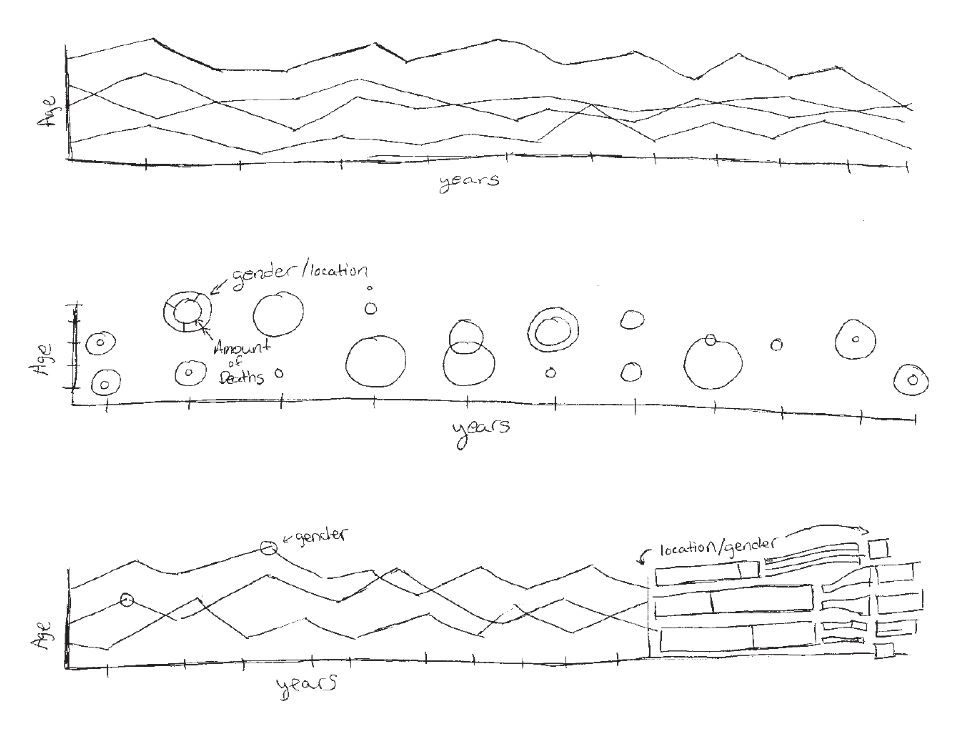
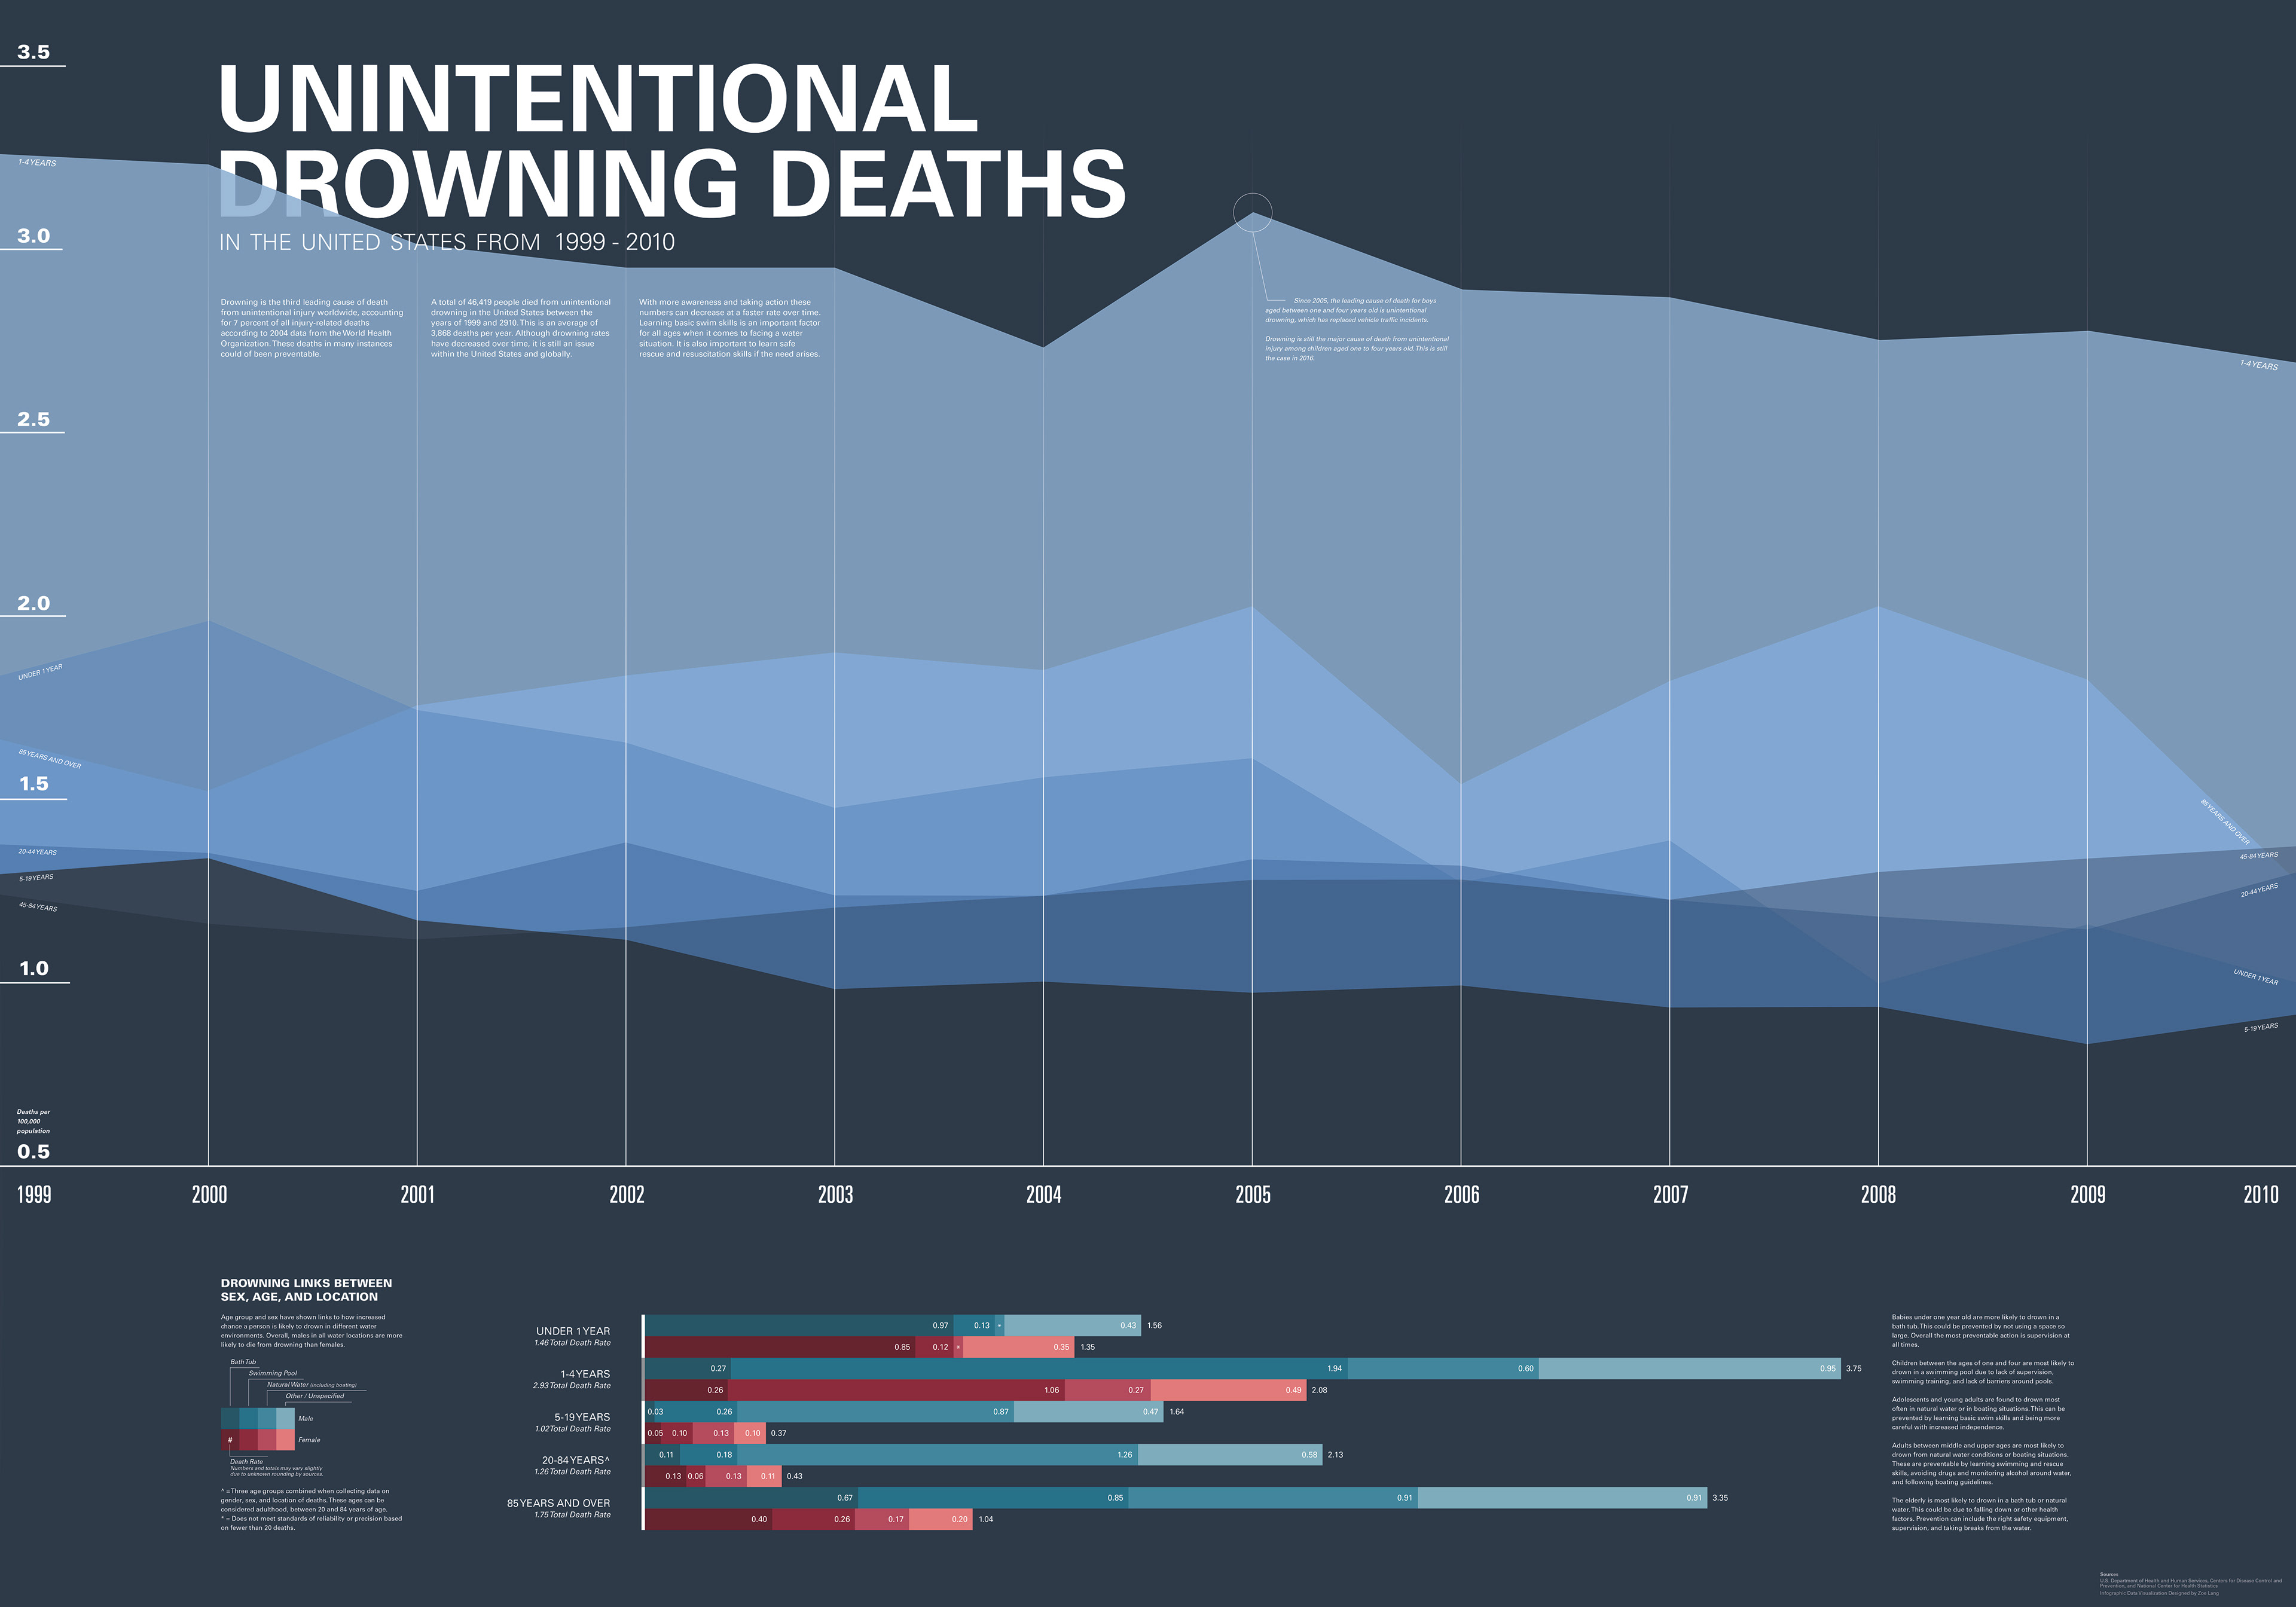
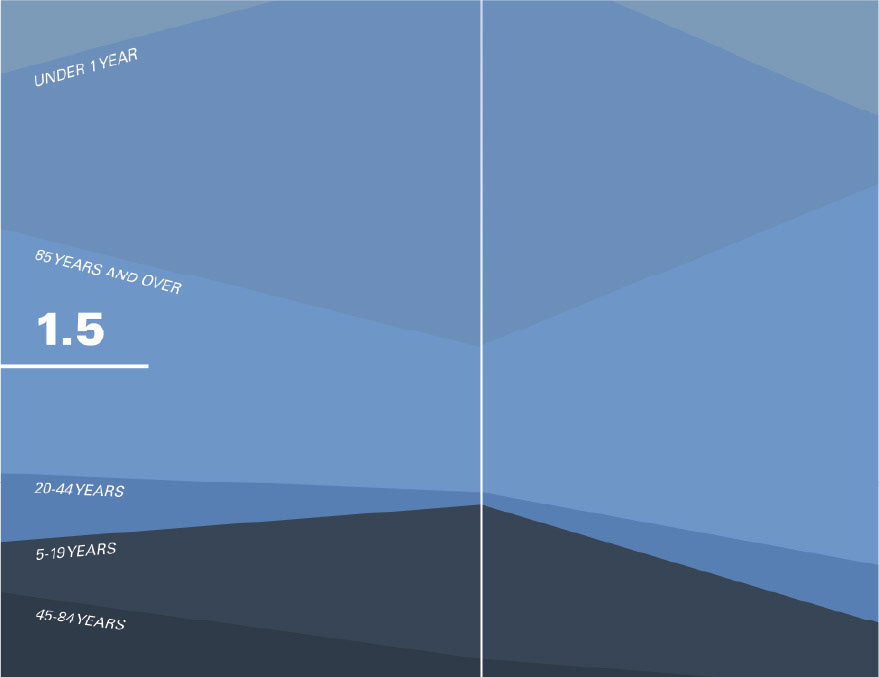
This infographic explores trends in unintentional drowning deaths across the United States through data-driven visual storytelling, with a particular focus on raising awareness about childhood drowning incidents and water safety prevention. Extensive research and analysis of various chart formats led to the selection of a line graph as the primary visualization method, allowing for clear communication of changes over time and comparisons between age groups.
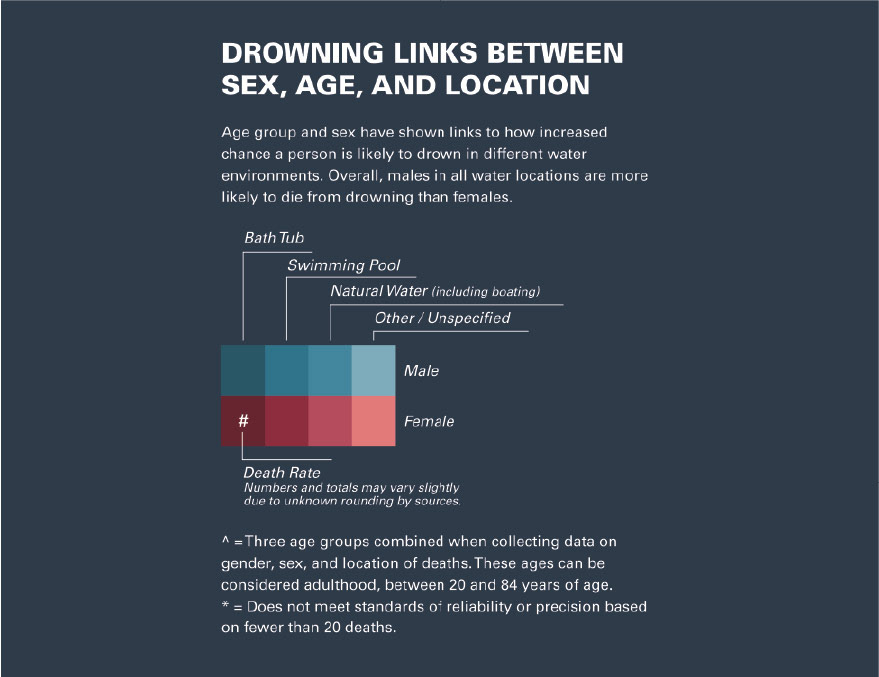
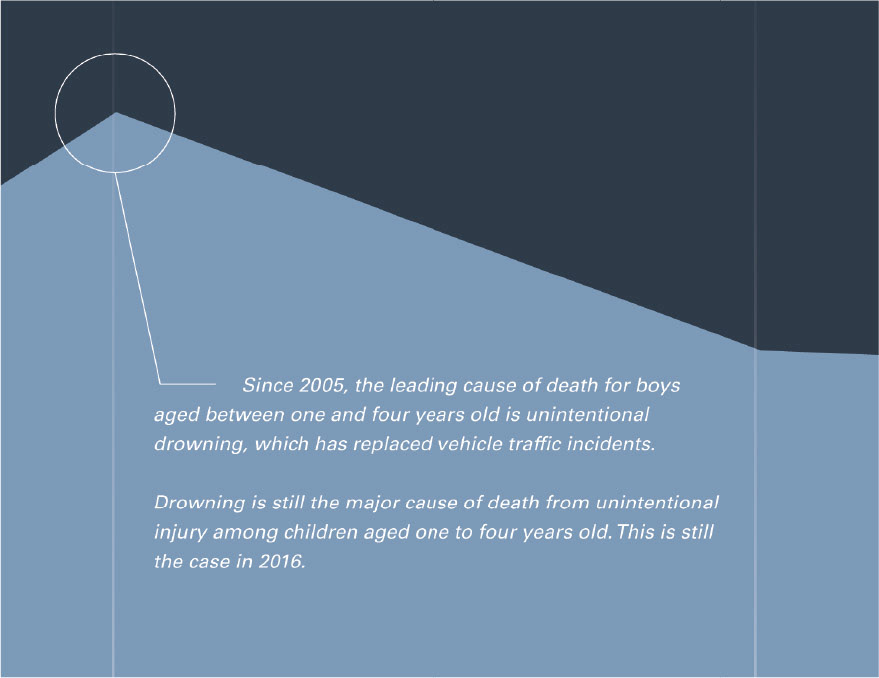
The final design enables viewers to quickly identify patterns and disparities related to age, gender, and location. In addition to presenting statistical data, the infographic emphasizes the importance of closely monitoring children around bathtubs, pools, and other bodies of water, as well as teaching children proper swimming and water safety skills at an early age. The project aims to educate viewers on preventative measures that can help reduce unintentional drowning deaths and promote greater public awareness.
Research & Data Collection
Data Visualization
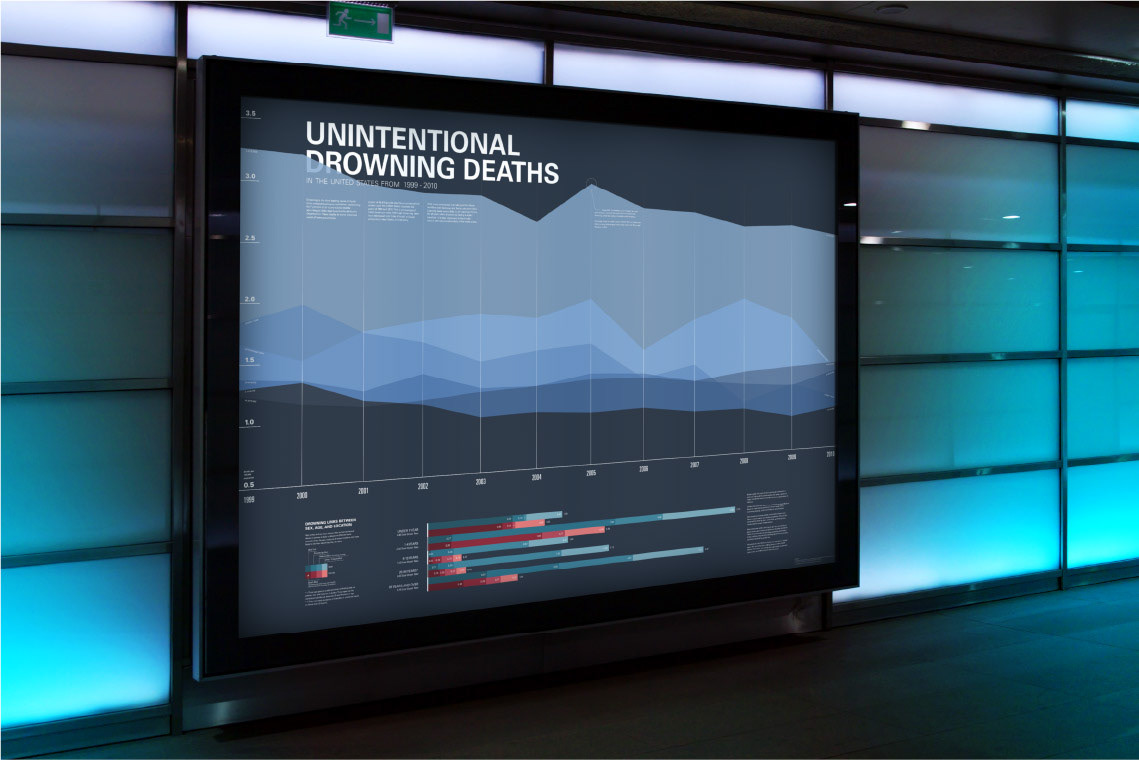
Infographic Design
Initial Sketches